
Easily profile your PowerShell code with the Profiler module
Premature optimization may be the root of all evil, but that doesn’t mean you shouldn’t optimize your code where it matters. Rather than guessing which code is slow and spending time optimizing code that doesn’t need it, you should profile your code to find the true bottlenecks. At that point you can decide if the code is slow enough to warrant optimizing.
Jakub Jareš has created the amazing Profiler module GitHub repo for profiling PowerShell code to find which parts are the slowest. Installing and using it is a breeze.
In this post I will walk through how I used Profiler to find a surprisingly slow part of a new PowerShell module I am developing, called tiPS. I noticed that importing tiPS in my PowerShell profile was noticeably slowing down my PowerShell session startup time, so I decided to profile it to see if I could optimize it.
TL;DR
If you don’t want to read this entire post, just run these commands and thank me (and Jakub) later:
Install-Module -Name Profiler
$trace = Trace-Script -ScriptBlock { & 'C:\Path\To\Script.ps1' }
$trace.Top50SelfDuration | Out-GridView
Installing the Profiler module
The Profiler module is available on the PowerShell Gallery here, so you can install it with:
Install-Module -Name Profiler
Tracing code with the Profiler module
You profile code by tracing it, which is done with the Trace-Script command.
This works similarly to the Measure-Command cmdlet, but provides more detailed information.
To use the Profiler, simply wrap the code you want to profile in a script block and pass it to the Trace-Script command, and capture the output in a variable.
Trace some code inline:
$trace = Trace-Script -ScriptBlock {
    # Code to profile goes here
}
Trace some code in a script file:
$trace = Trace-Script -ScriptBlock { & 'C:\Path\To\Script.ps1' }
Trace some code in a script file that takes parameters:
$trace = Trace-Script -ScriptBlock { & 'C:\Path\To\Script.ps1' -Parameter 'Value' }
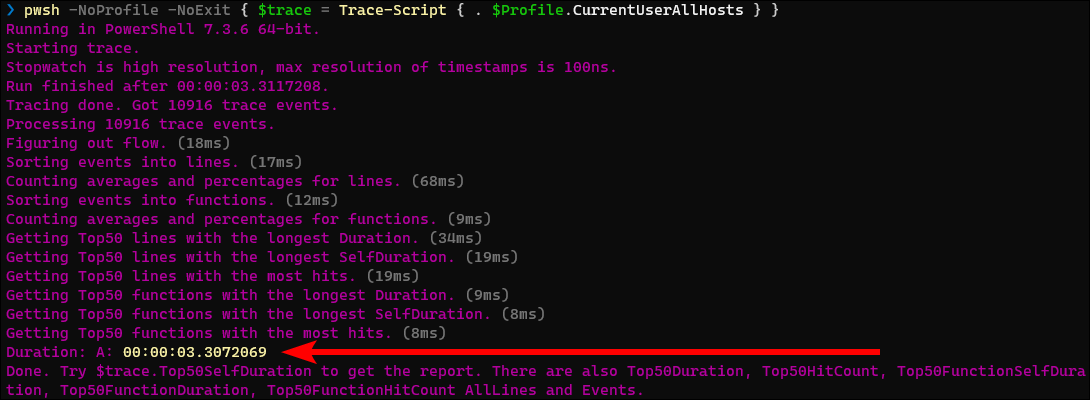
Trace the code in your $Profile script that is run on every new session:
pwsh -NoProfile -NoExit { $trace = Trace-Script { . $Profile } }
Note: Depending on how you have your profile configured (MS docs), you may need to reference one of the other profile file paths, such as $Profile.CurrentUserAllHosts.
Let’s walk through tracing the code I have in my profile script to see if I can reduce my PowerShell session startup time.
You will notice some summary information is output to the console when you run the Trace-Script command, including the total Duration, which is the same info that the Measure-Command cmdlet would have given us.
Viewing the profile trace information
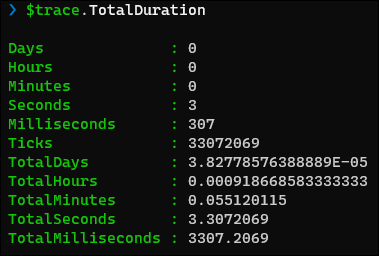
Now that we have the trace information in the $trace variable, you can inspect its properties to view the trace info.
The TotalDuration property is the same TimeSpan that Measure-Command would have given us:
The real value of the Profiler is in the Top50SelfDuration and Top50Duration properties, which is a list of the top 50 slowest commands in the trace.
The 2 properties show similar information, just sorted based on SelfDuration or Duration respectively.
SelfDurationis the time spent in the command itself, not including any time spent in functions that it called. This shows you the lines of code that are actually slow in the script.Durationis the time spent in the command, including all other functions it called. It shows the bigger pieces that are slow because they contain smaller slow pieces.
A good strategy is to look at the Top50SelfDuration first to see which specific lines of code are the slowest.
You can then look at the Top50Duration to see which larger parts of your script take the most time, and see if it matches your expectations.
Here is the output of the Top50SelfDuration property:
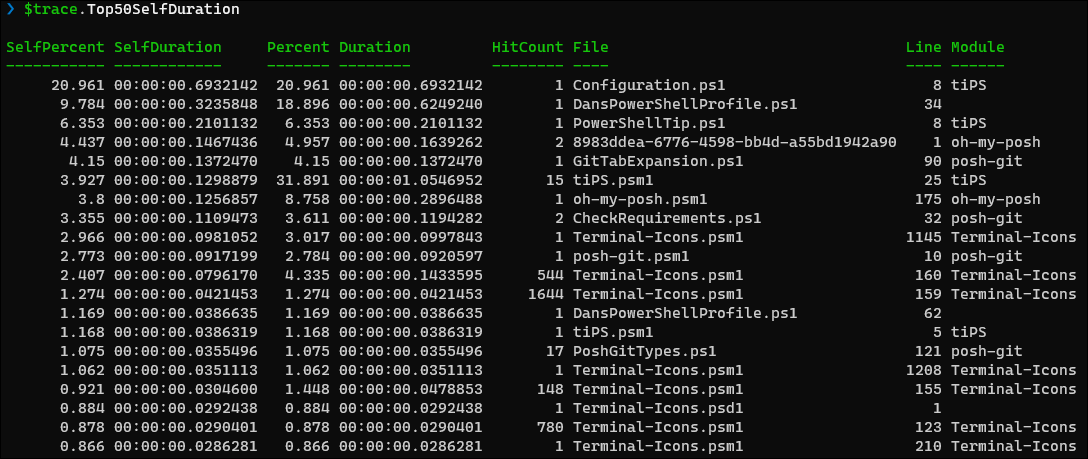
In this screenshot we can see that the top offender (the first row) is a line in the tiPS module’s Configuration.ps1 file on line 8, which is called once and taking 693 milliseconds to execute.
tiPS is a module that I am currently developing and have added to my profile to automatically import it on every new session.
By default the Top50SelfDuration and Top50Duration display their output in a table view.
Unfortunately the number of columns displayed is based on your console window width.
If we make the console window wider, we can see 2 more very useful columns: Function and Text, which is the actual line of code that was executed.
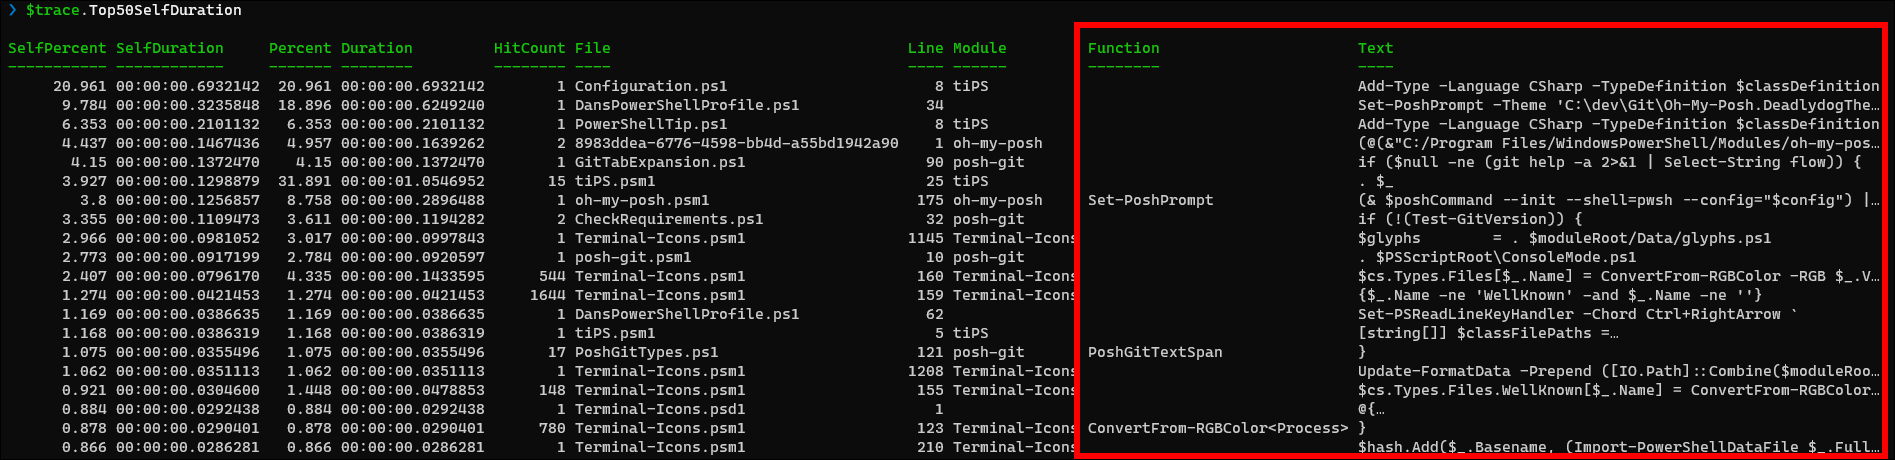
Even with the wider console window, much of the text is still cut off.
To see the full text we have a couple options.
We can pipe the output to Format-List:
$trace.Top50SelfDuration | Format-List
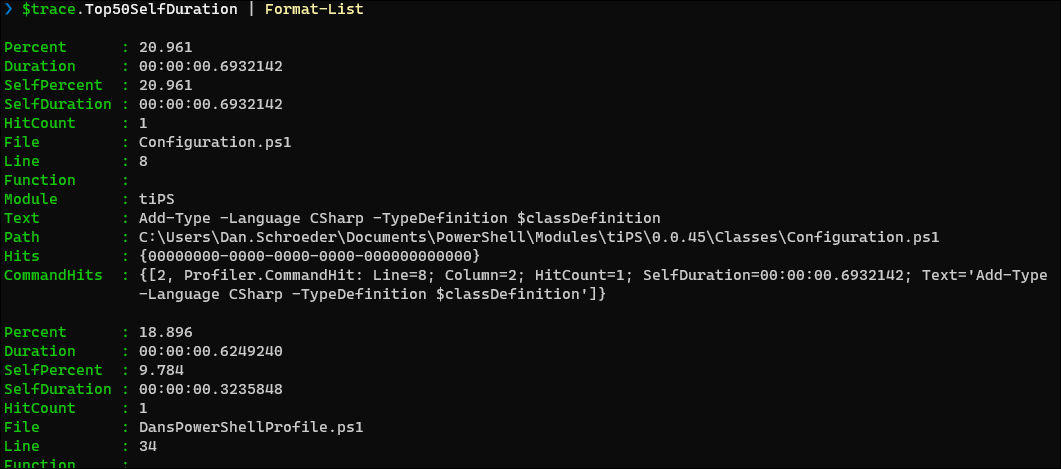
This is good for seeing details about each individual entry, but not great for viewing the entire list.
My preferred approach is to pipe the results to Out-GridView:
$trace.Top50SelfDuration | Out-GridView
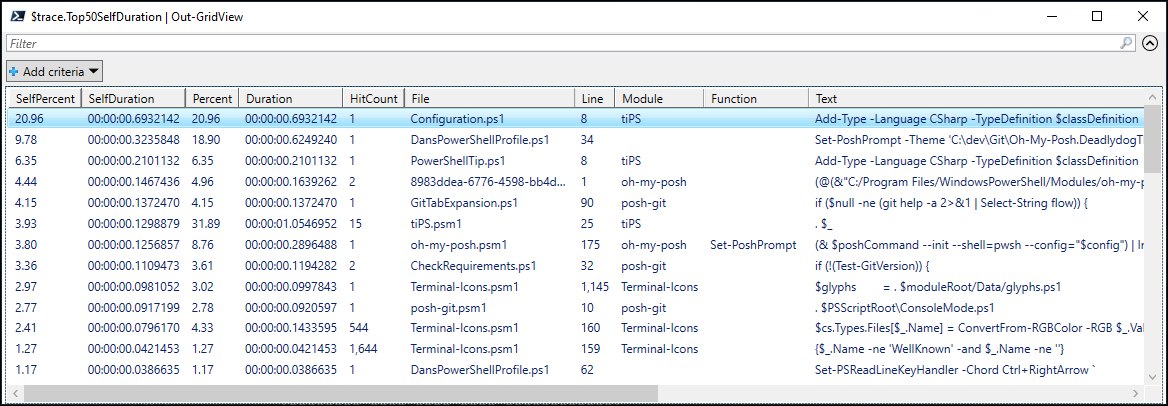
This allows me to see all of the columns, reorder and hide columns I don’t care about, as well as sort and filter the results.
Now that we have the Text column, we can see that the top offender is a call to Add-Type -Language CSharp.
Since tiPS is my module, I know that line is being used to compile and import some inline C# code.
The 3rd row shows the same operation for importing a different C# file.
Since it is a single line of code calling a library that I do not own, there’s not much I can do to optimize it outside of considering a different strategy for importing C# code or not using C# at all, which may be something to consider.
Moving on, the 2nd row shows a call to Set-PoshPrompt taking 624 milliseconds.
I use this third party module to customize my prompt with oh-my-posh.
In fact, looking at the Module column, you can see many of the slowest commands are coming from 3 third party modules that I import in my profile script: oh-my-posh, posh-git, and Terminal-Icons.
Since it is third party code there’s not much I can do outside of not loading those modules automatically at startup, which I may decide to do if they impact my startup time enough.
With that in mind, let’s focus on the code that I can optimize.
The 6th row shows another top offending line in the tiPS module.
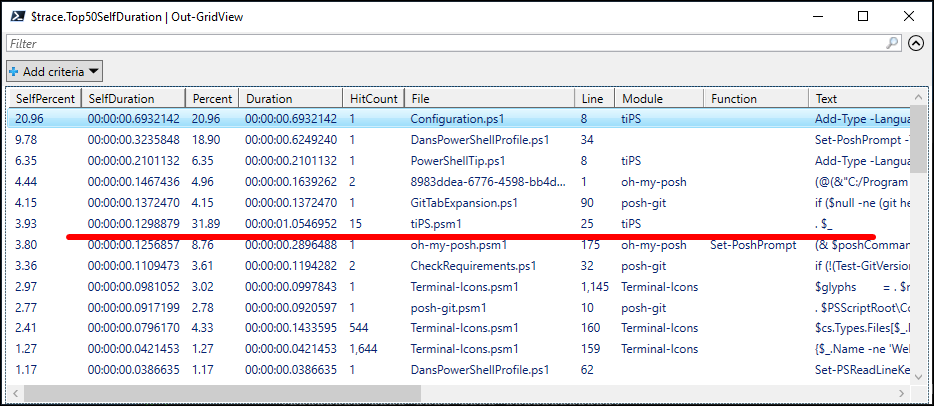
Notice that this line has a total Duration of 1054 milliseconds, due to it being called 15 times.
On initial inspection, it appears that this line of code is slowing the module load time even more than our initial top offender (we’ll come back to this).
This is made more apparent when we sort by Duration:
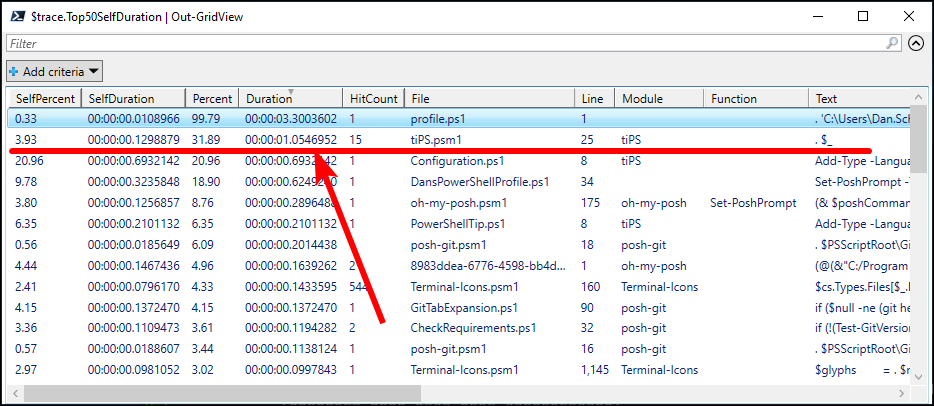
We can ignore the top row as it is dot-sourcing the file that contains all of my custom profile code, which is why the Percent shows as 99.79.
I keep my custom profile code in a separate file and dot-source it into the official $Profile so that it can be shared between PowerShell 5 and Pwsh 7, as well as automatically backed up on OneDrive.
Looking in my tiPS.psm1 file on line 25, I see that it is looping over all of the files in the module directory and dot-sourcing them:
$functionFilePathsToImport | ForEach-Object {
    . $_
}
This dot-sourcing strategy allows for better code organization by keeping module functions in separate files, rather than having one giant .psm1 file with all of the module code. A quick Google search shows me that others have come across this dot-sourcing performance issue as well. Naively we may think that this is giving additional evidence that the dot-sourcing may be the main issue.
Earlier we saw that the Add-Type command was taking 693ms in Configuration.ps1, and 210ms in PowerShellTip.ps1.
That is 903ms total.
I did a Trace-Script -ScriptBlock { Import-Module -Name tiPS } to see how long it takes to just import the tiPS module, and found the entire import takes 1180ms.
Configuration.ps1 and PowerShellTip.ps1 are 2 of the 15 files that get dot-sourced in the module, and they alone take 903ms of the 1180ms to load the module.
This highlights the difference between SelfDuration and Duration.
The Duration of the dot-sourcing was including the time spent in all of the operations of the dot-sourced files, such as the Add-Typeoperations.
In the screenshot we can see that the dot-sourcing Duration is 1054ms, and the SelfDuration is 129ms.
So the act of dot-sourcing the 15 files, regardless of what the files contain, is taking 129ms.
We know it takes 903ms to execute the two Add-Type commands in the dot-sourced files, so that means the time it takes to execute the operations in the other 13 files being dot-sourced is 1054ms - 903ms = 151ms.
So dot-sourcing 15 files takes 129ms, which isn’t too bad.
I imagine (but did not test) the time will increase linearly with the number of files dot-sourced, so if you have a large project that dot-sources hundreds of files, you could be looking at several seconds of time spent just dot-sourcing the files; not executing the code in the files.
While dot-sourcing is a bit slow, it is not the main offender in my scenario.
The main performance issue is the Add-Type commands to compile and import the C# code.
I never anticipated that one command would have such a drastic impact on the module load time!
Since the tiPS module is intended to be loaded on every new PowerShell session, I need to find a way to speed up the module load time. This might mean not using C# code, or taking some other approach; I’m not sure yet. The main point is that I now know where the bottleneck is and can focus my efforts on optimizing that code.
Conclusion
By using the Profiler module for less than 2 minutes I was able to identify a major performance issue that I would not have otherwise known about. Without it, I likely would have spent time optimizing other parts of my code that would not have as much impact.
Profiling your code is as easy as:
Install-Module -Name Profiler
then:
$trace = Trace-Script -ScriptBlock { & 'C:\Path\To\Script.ps1' }
$trace.Top50SelfDuration | Out-GridView
Profiler has more features that I did not cover in this post, such as using Flags to easily change the functionality of the code in the script block and compare them (e.g. to compare two different implementations), and functions for running the script block multiple times and taking the average performance metrics. Be sure to check out the Profiler git repo for more info.
I hope you’ve found this post helpful.
Happy profiling!
Leave a Comment
Your email address will not be published. Required fields are marked *