Just like you might define an alias for a function, you can define an alias for a .NET class or enum type, only it’s called a “type accelerator”. It turns out that I (and probably you) had been using them all along without realizing it.
Built-in type accelerators
Here are some common built-in type accelerators:
[int] # Instead of [System.Int32]
[string] # Instead of [System.String]
[bool] # Instead of [System.Boolean]
[datetime] # Instead of [System.DateTime]
[array] # Instead of [System.Array]
[hashtable] # Instead of [System.Collections.Hashtable]
[xml] # Instead of [System.Xml.XmlDocument]
[regex] # Instead of [System.Text.RegularExpressions.Regex]
[pscredential] # Instead of [System.Management.Automation.PSCredential]
[pscustomobject] # Instead of [System.Management.Automation.PSCustomObject]
[ipaddress] # Instead of [System.Net.IPAddress]
So the following two lines are equivalent:
[int] $myInt = 5
[System.Int32] $myInt = 5
And these two lines are equivalent:
[string]::IsNullOrWhitespace($myString)
[System.String]::IsNullOrWhitespace($myString)
And these two lines are equivalent:
[pscredential] $myCred = Get-Credential
[System.Management.Automation.PSCredential] $myCred = Get-Credential
And these two lines are equivalent:
[pscustomobject] $myObject = @{ Name = 'John'; Age = 30 }
[System.Management.Automation.PSCustomObject] $myObject = @{ Name = 'John'; Age = 30 }
Basically, type accelerators are just an alias for a fully qualified .NET type name.
The first two examples don’t save too many keystrokes, but ones like [pscredential] instead of remembering System.Management.Automation.PSCredential can be a real time saver.
Before understanding that they are simply an alias, I would do a Google lookup for the full type name every time I needed to use a non-common one, to make sure it would work on not only my machine, but others’ as well. Knowing that they are aliases built into the language gives me confidence to use them in my scripts, regardless of the machine they’re run on.
Be sure to check out the full list of built-in type accelerators in the MS docs, as there are quite a few.
Get all type accelerators
You can get a list of all of the built-in type accelerators for your PowerShell version by running the following command:
[PSObject].Assembly.GetType('System.Management.Automation.TypeAccelerators')::Get
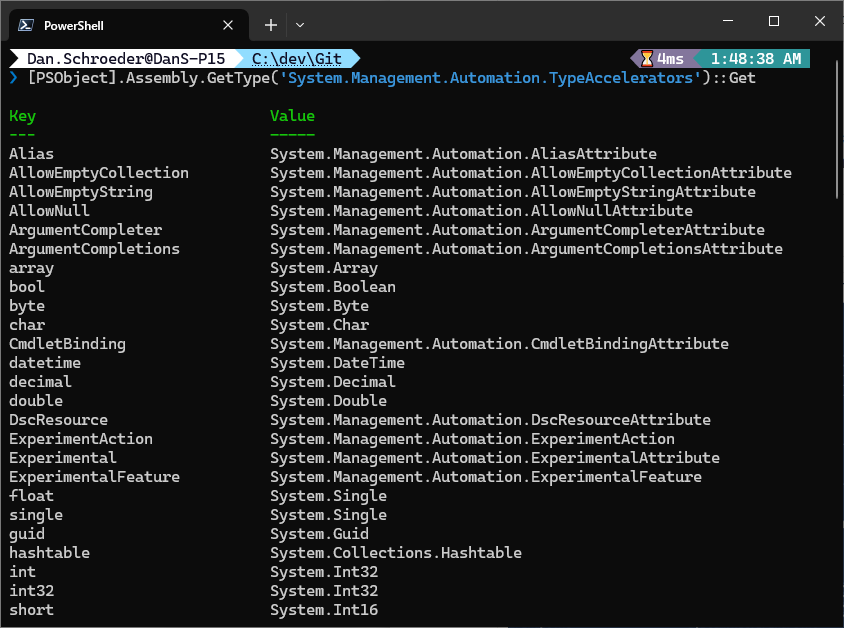
This is similar to running Get-Alias to get a list of all cmdlet aliases, only these are for class/enum types.
Custom type accelerators
You can also create your own type accelerators, whether for your own classes/enums, or for .NET classes that don’t have built-in aliases.
Here’s an example of creating a type accelerator for the System.Net.Http.HttpClient class:
$accelerator = [PSObject].Assembly.GetType('System.Management.Automation.TypeAccelerators')
$accelerator::Add('HttpClient', 'System.Net.Http.HttpClient')
Now you can use [HttpClient] instead of [System.Net.Http.HttpClient] in your scripts, like this:
[HttpClient] $client = New-Object HttpClient
Beware that custom type accelerators only apply if they’re included in the script or module that defines them; they are not available globally like the built-in ones.
This means that if you defined a custom type accelerator in one script, it may not be available in another script.
Similarly, if you define a custom type accelerator in your $Profile, it will be available on your local machine, but may not be available if the script is run on a different machine.
Type accelerators in modules
If you’re creating a module and want to include a custom type accelerator for your module’s class/enum so it can be easily referenced, you can include the type accelerator definition in your module’s .psm1 file.
See the MS documentation for more details.
Using namespaces instead of type accelerators
Rather than creating a bunch of custom type accelerators for .NET types that don’t have built-in ones, you can instead use the using namespace statement to import an entire namespace and then use the types in that namespace without needing the fully qualified name.
Here’s an example of using the using namespace statement to import the System.Net.Http namespace and then use the HttpClient and HttpRequestHeaders classes without the fully qualified name:
using namespace System.Net.Http

$myHttpClient = [HttpClient]::new() # Instead of [System.Net.Http.HttpClient]::new()
$headers = [HttpRequestHeaders]::new() # Instead of [System.Net.Http.Headers.HttpRequestHeaders]::new()
A common one that I find myself using is:
using namespace System.IO

$myFileContents = [File]::ReadAllText('C:\path\to\file.txt') # Instead of [System.IO.File]::ReadAllText('C:\path\to\file.txt')
This is a great alternative to using .NET types without having to type out their fully qualified name every time, or define a custom type accelerator for them.
Conclusion
Type accelerators are a great way to save keystrokes.
There are built-in aliases for many .NET types, and you can create your own custom type accelerators as well.
If you find yourself using a .NET type often, consider using it’s type accelerator, or including a using namespace statement to import it’s namespace.
Just remember that if you include a custom type accelerator or namespace in your $Profile, it may not be available on other machines.
For more information and examples of using type accelerators, check out this awesome blog post by 4syspos.
Happy scripting!
]]>